Manage Your Investments

Investing is often blown out of proportion in terms of its complexity and the seemingly all-consuming time and effort required to be successful. The truth is, investing should be relatively simple for many people, especially those with youth on their side. Commonplace logic tends to believe that successful investment returns are brought about by a Warren Buffet-style portfolio manager in a New York office, or a statistically-driven analyst who day trades stocks with four computer monitors.
The truth is that most professionally managed investment portfolios are unable to produce returns that CONSISTENTLY outperform their benchmarks. In most cases, a simple and consistent investment strategy is the optimal choice for almost all investors.
Before diving into many of the concepts discussed on this page, it is highly recommended to familiarize yourself with the very basics of investment management. Without a basic understanding of knowledge, truly realizing the benefits of investing will be a tougher task to grasp.
Basic pre-requisites to understand:
Stocks: (click the link to learn more)
- Owning stock (otherwise known as "equity") is ownership in a for-profit company, turning an investor into a "shareholder"
- A company may offer different types of stock, with some having basic rights, voting rights, preferred rights
- Companies sell stock in their company to raise funds for future revenue-generating activities, among other reasons
- A stock provides value to its shareholders through increases in its stock price (capital appreciation) and paying out dividends (either in cash, additional shares, or a recurring dividend rate)
- Stocks are classified into many different categories, here are the basics:
- Market Capitalization: This is what the investment industry generally uses to classify the size of a company, this can be accomplished by multiplying the stock price by the number of outstanding shares available to investors. The main market cap sizes include small-cap, mid-cap, large-cap
- Characteristics: Many different company-specific factors are used in characterizing the nature of a company's stock.
- The most common is "Value" which tends to be associated with firms that are more stable and mature within their respective industry, and typically pay higher dividends as their earnings are consistent as they are an established player within their space (for example, Verizon).
- Growth firms are characterized as fighting for market share within their industry, focused on growing and expanding their operations (for example, Microsoft), and prioritizing reinvesting the majority of their revenues back into the business, rather than paying out significant dividends to shareholders.
- Domestic firms are self-explanatory, these are companies based in the US.
- International firms are based outside of the US. These can include companies based in Developed or Emerging Markets. Emerging Markets are less-established economies, and thus possess inherently more risk than firms operating in developed markets. US-based investors are able to purchase shares in foreign markets through American Depositary Receipts. ADRs are essentially "certificates" of stock ownership in a foreign company, owned through a US bank. The US bank goes to the foreign markets and purchases shares, which it can then sell to US investors.
Bonds: (click the link to learn more)
- Owning a bond (otherwise known as "debt") is essentially a loan provided by the investor to the issuing company or country, in return, a stated interest rate is paid to the investor (usually periodically), and the investor's original loan amount (the "principal") is returned upon the maturity of the bond
- There are many, many different types of bonds (the bond market is worth more than the global stock market), but the most common type of bond pays a "coupon" based on the stated rate of interest to the investor periodically
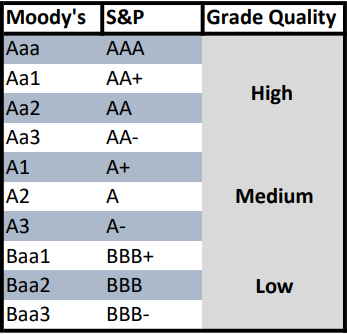
- Bonds are generally "safer" than stocks, but there are varying degrees of risk for each bond based on the credit quality of the company or nation issuing the bond, the length of time the bond is set to exist for (maturity), its sensitivity to increases in interest rates (duration), and many more factors
Other Notable Investments:
- Real Estate Investment Trusts (REITs): REITs can own, operate, and finance various real estate investments. Some REITs specialize in owning and operating properties (known as Equity REITs), while some REITs specialize in lending money to real estate owners through loans (known as Mortgage REITs). Publicly Traded REITs can be bought and sold on a stock exchange similar to most securities, while Privately Traded REITs are not traded so easily. This is known as "liquidity risk," because if an investor needed to access their principal investment immediately they would have to wait a certain period of time.
- Commodities: These are basic goods, such as oil, precious metals, grain, livestock, fine art, etc. Most investors who want exposure to a specific commodity typically do so by purchasing an investment fund that owns the underlying asset specified in their fund prospectus.
Investment Funds:
Investment funds allow investors to purchase a single fund, which in turn will own many different securities (individual stocks, bonds, etc.) inside of the fund. This grants investors ownership across a multitude of individual investments by simply purchasing shares of the underlying fund, without having to buy all the individual securities within the fund. Gaining exposure to the largest companies in the US or Europe can be easily achieved by owning shares of an investment fund. There are thousands of funds that offer exposure to a variety of different markets and assets (stocks, bonds, real estate, etc.).
There are two main investment vehicles that we will focus on:
Mutual Funds & Exchange-Traded Funds (ETFs)
Mutual Funds: These funds tend to focus on achieving higher returns than that of the broader market through actively buying/selling securities within the fund.
Exchange-Traded Funds (ETFs): These funds tend to focus on tracking the performance of the broader market itself. Rather than buying/selling in an active manner, most ETFs simply purchase the funds of an underlying index in order to track that market and only change the investments within the fund (click on the hyperlink to learn what an index is).
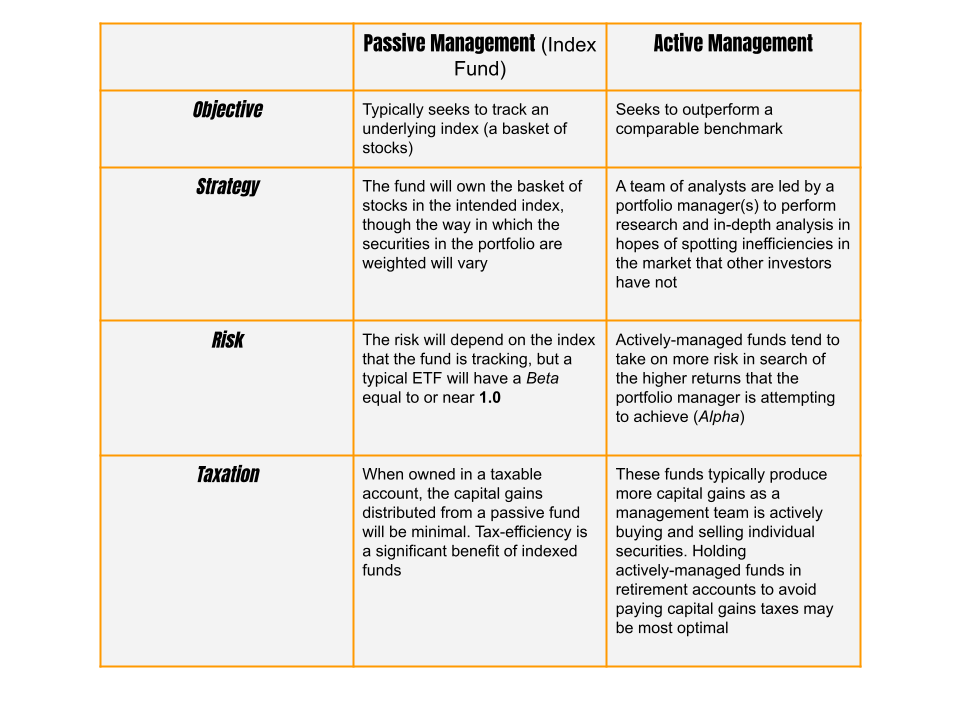
Which funds should you invest in? This is highly dependent upon the individual, but it can be said with a certain level of confidence that passively managed funds with low-cost management fees are your best bet. Keep in mind that while Mutual Funds tend to be actively managed, and ETFs passively managed, these management styles can be employed in either investment.
Consider this study from Vanguard (one of the largest money managers in the world):
Over the past 15 years, only about 37% of active stock fund managers and 19% of active bond fund managers have outperformed their designated benchmarks.*
Active stock fund managers
37% outperformed benchmarks.
63% underperformed benchmarks.
Sources: Vanguard calculations, using data from Lipper, a Thomson Reuters Company. Based on funds' excess returns relative to their prospectus benchmark for the 15-year period ended March 31, 2020. Only funds with a minimum 15-year history were included in the comparison. Results for other periods will vary.
Due to these factual pieces of evidence, avoiding most actively managed investment funds may be preferable as their unnecessary management fees are much less likely to outperform a passively managed index fund.
Developing a basic understanding of how these funds operate is essential to creating your own investment portfolio. A few important items should be considered when researching a fund, such as the ones below.
- Performance Benchmark: A standard performance measure. A portfolio's performance is compared to a benchmark to convey under or over-performance against what is expected.
- Alpha (α): The return on an investment in excess of a benchmark. Generating positive Alpha translates to generating a higher return than that of the appropriate benchmark.
- Risk Measurements:
- Beta (β): A measure of the expected movement in the value of an investment relative to the broader market (i.e. the S&P 500 has a Beta of 1.0, Apple Inc. has a Beta of 1.25, meaning the stock contains more inherent risk than the S&P 500)
- Standard Deviation (σ): A measure of a given data set's dispersion from the mean (average). In other words, how the price of an investment has fluctuated in the past. The higher the fluctuation (or standard deviation), the higher the risk of the asset.
- Fees: The fee's on a particular investment fund are crucial to determining the investor's potential return. High management fees subtract from an investment's total return, and over many years can be costly, especially considering the plethora of low-cost investments available. Trading costs need to be taken into consideration as well, as certain investments will charge investors a fee for purchasing and or selling out of their fund.
How to research investment funds:
Hours of analysis are not necessary when researching an investment fund, but having a basic understanding of the ins and outs of the fund is advisable. Here are a few quality sites to utilize when researching investments, and comparing them to potential alternatives.
- Basic Research: https://www.morningstar.com/
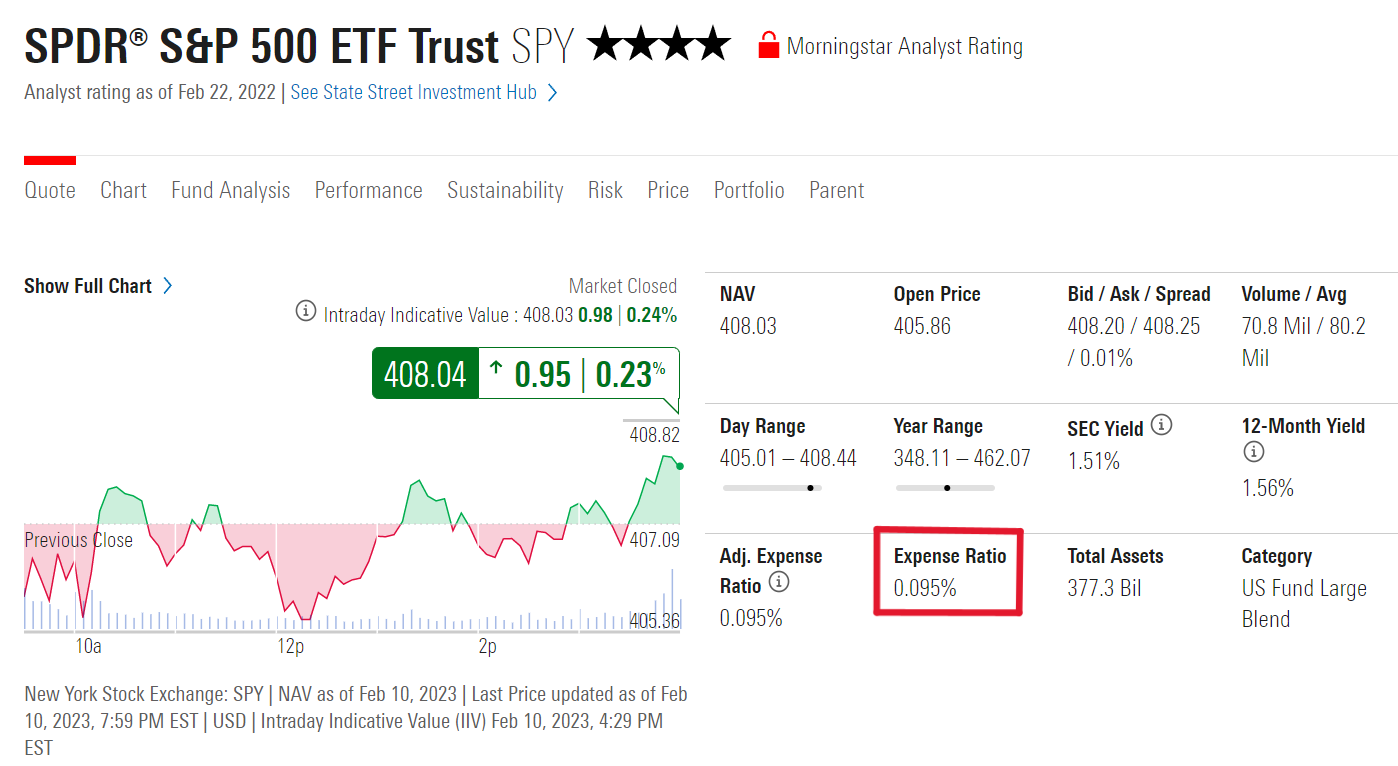
Let's conduct some basic research on SPY, which is the largest ETF in the US (~$380b in assets under management) that seeks to track the performance of the S&P 500 (500 largest companies in the US). After entering the ticker of the fund in the search bar (SPY), we are presented with this page. The most important metric we are looking for is the Expense Ratio. A desirable expense ratio for ETFs will be between 0.5-0.75%, with anything greater than 1.25% being considered high.
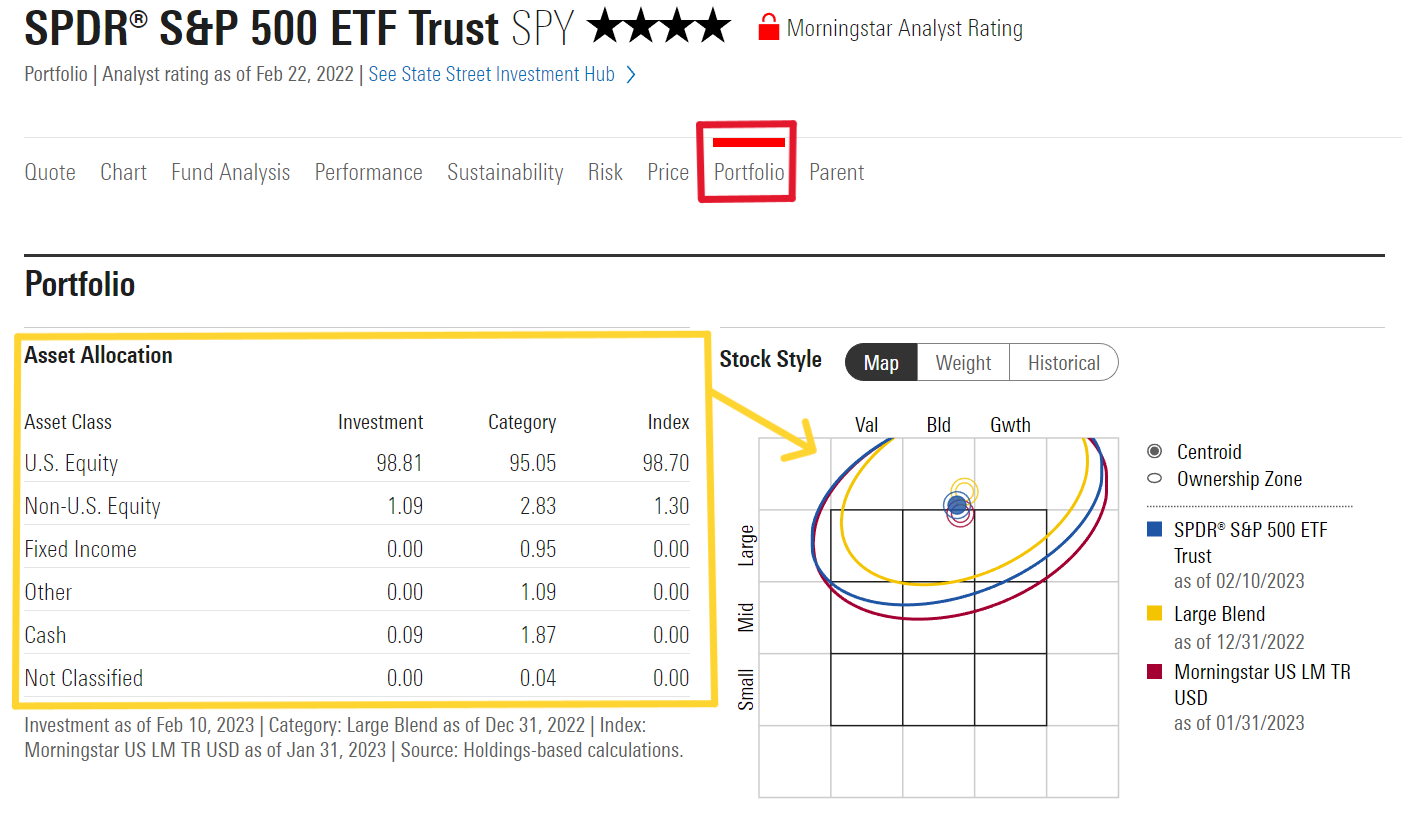
Next, select Portfolio to gain a better understanding of how the fund is invested (red square). The box in yellow displays the fund's allocation and in this case we can see that it is primarily invested in a blend of US equities (stocks), specifically Large-cap stocks (shown by the Morningstar style box the yellow arrow is pointing to).
When this site will prove useful:
- Researching the various investment options available in your 401(k)
- Determining which funds to add to other investment accounts
Comparing funds:
This is helpful when weighing up the pros and cons of comparable investments, which is likely the case for the investment options in your employer-sponsored retirement account. In this situation, a valuable tool to utilize is Vanguard's "Compare Products": https://advisors.vanguard.com/investments/portfolio-construction-tools/compare-products/
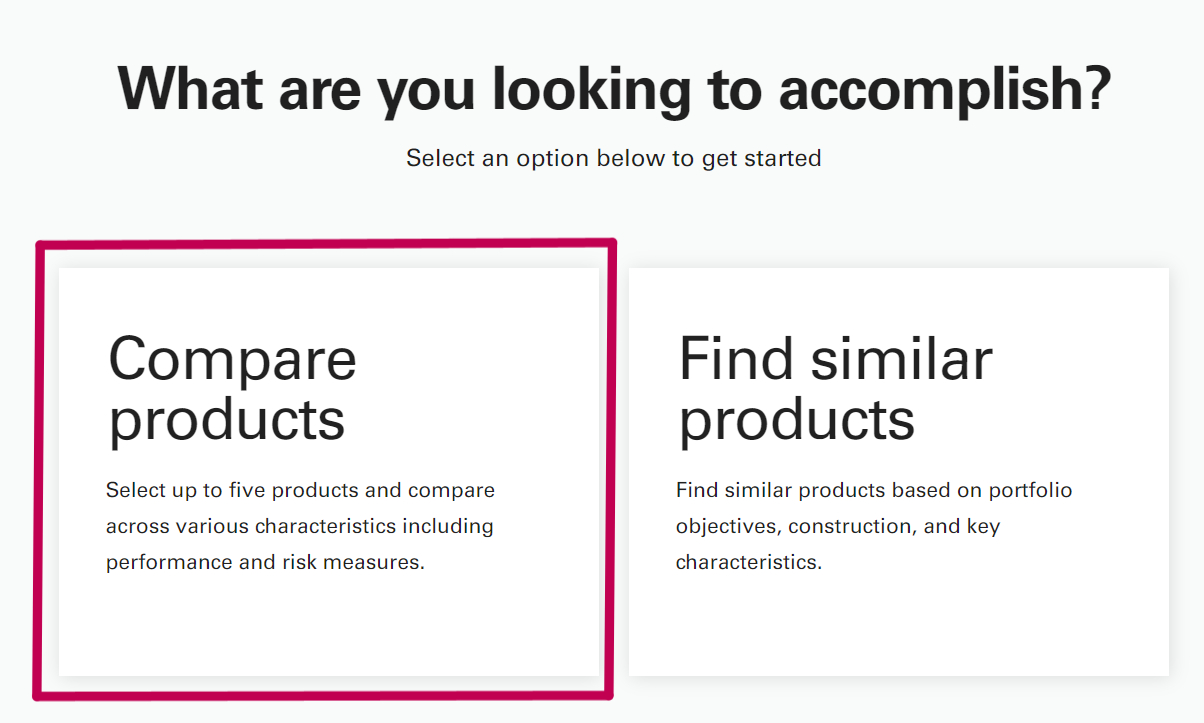
Start by selecting Compare Products, and enter the two funds you wish to compare. Ideally, these will be funds that aim to provide exposure to a similar asset class so as to be a fair comparison. In this example, we will be comparing SPY and PRBLX (both investing in US Large Cap stocks).
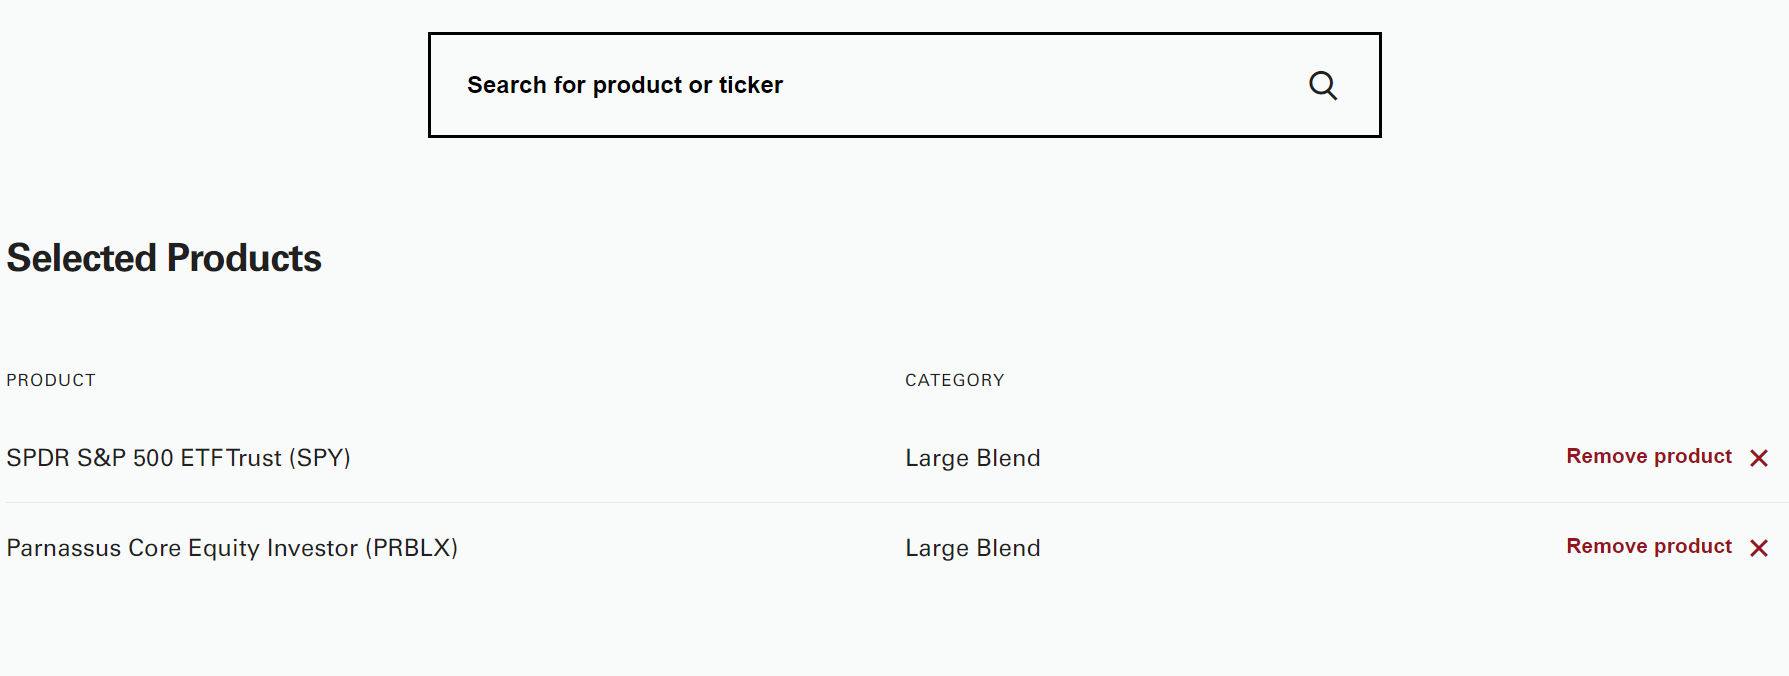
Generate the report, and pay attention to the most pertinent information (described below):
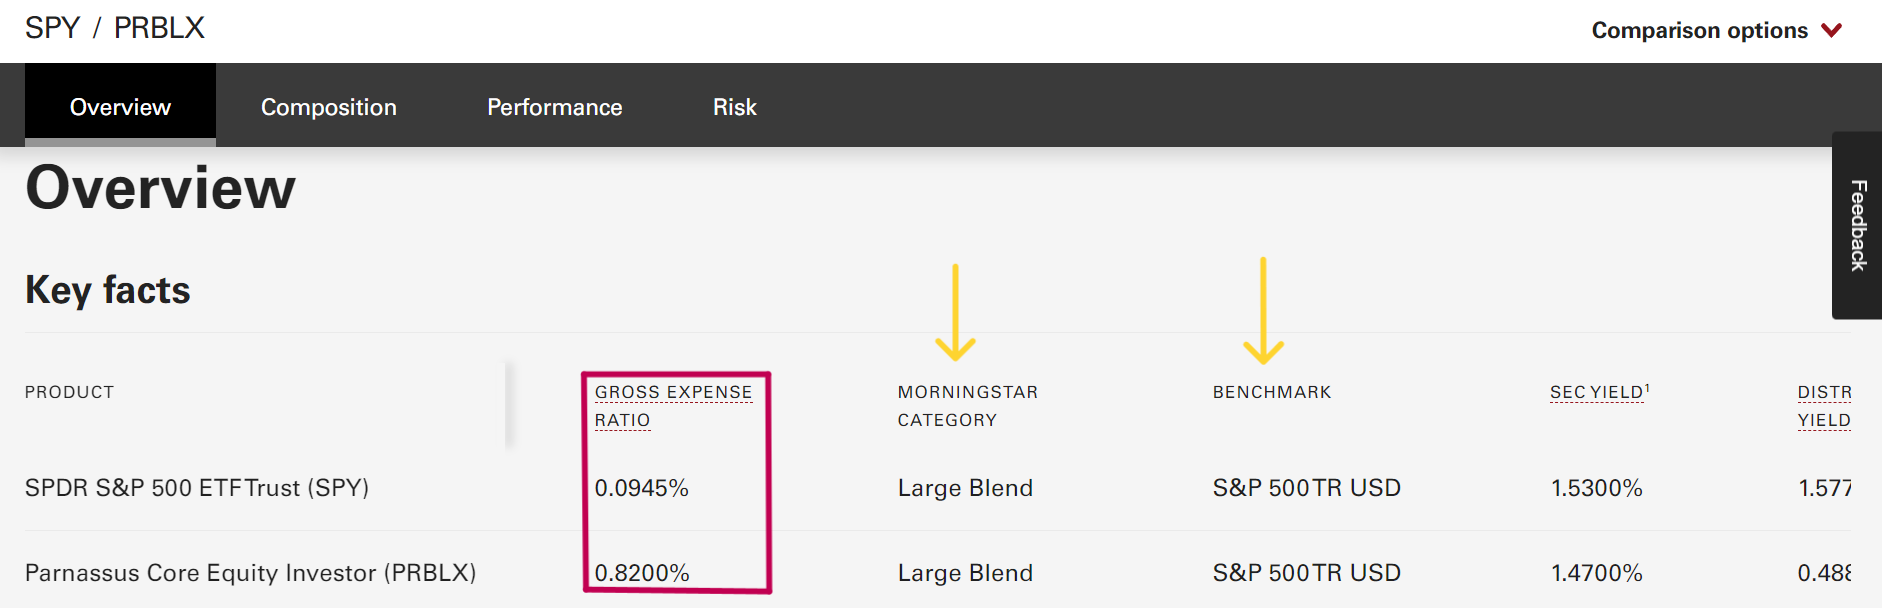
Pay attention to the Expense Ratio in this scenario, SPY has wildly lower fees than PRBLX. This is mostly due to PRBLX being an actively managed fund, attempting to lower risk during times of economic uncertainty, and investing in primarily "green" companies. These attributes all contribute to the fund company charging higher fees, we will see how this strategy plays out later on.
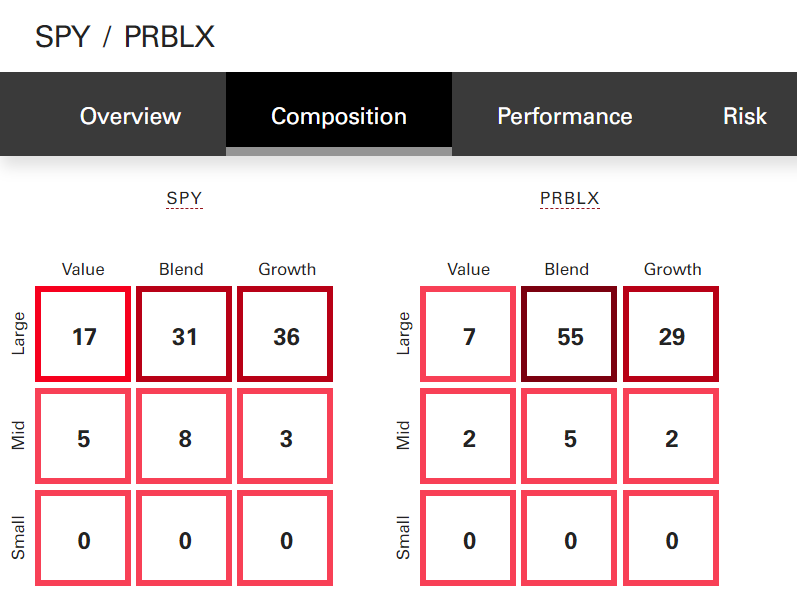
The composition shows us how the fund is invested (these boxes are known as "Morningstar Style Boxes"), here we can see how each fund differs in its allocation. Both funds are tilted toward Large Growth firms, with PRBLX having strong exposure to Blend companies. The exact allocation of each fund differs, but they are relatively similar and worthy of further comparison.
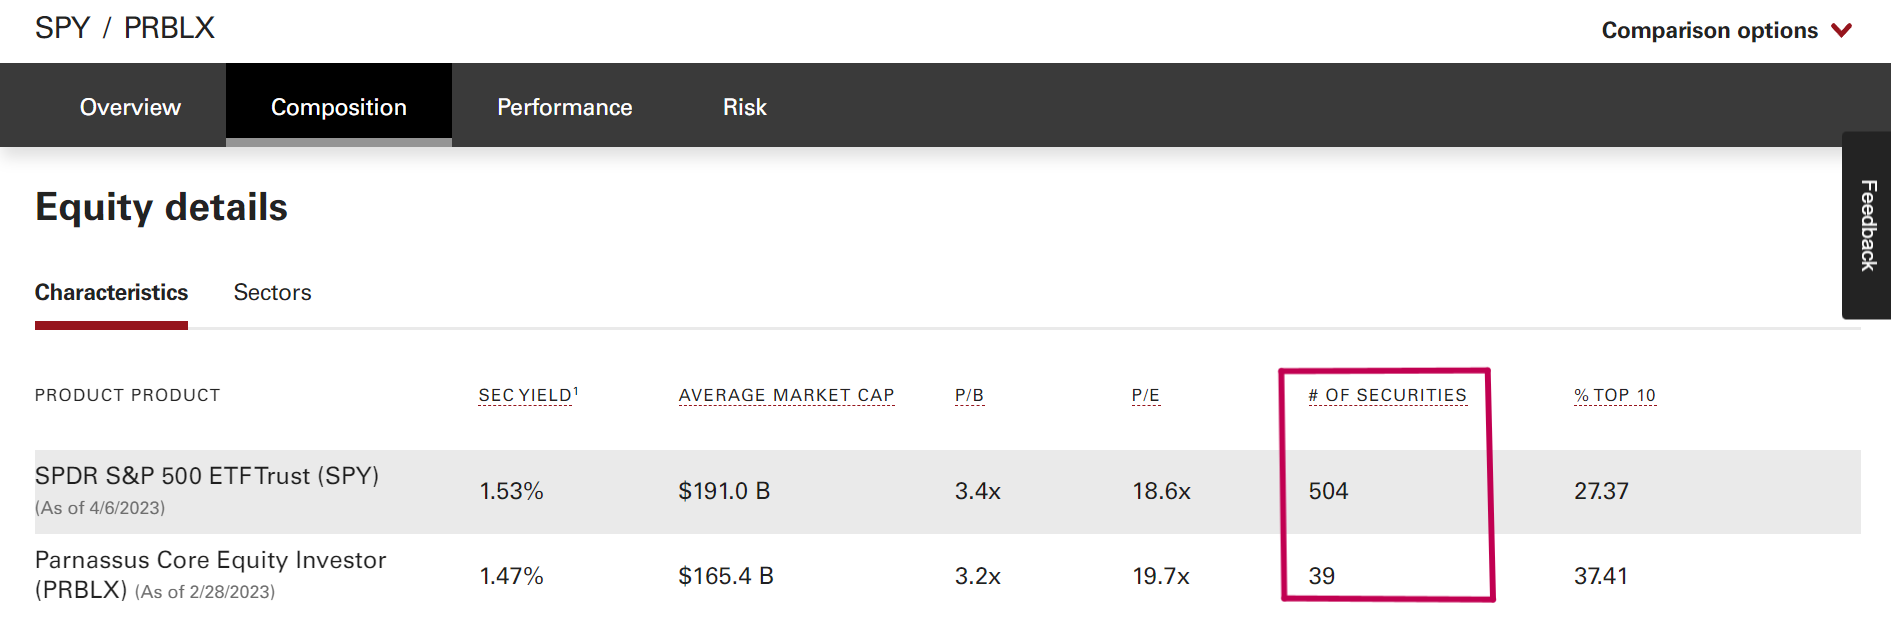
After scrolling down further, we can see a few more details behind the makeup of each investment. This information is not overly important, but it will highlight a few additional characteristics from each fund to take into consideration.
SPY aims to hold the companies listed in the S&P 500 Index (the exact number is 504), this allows investors in this fund to essentially capture the performance of the entire US market. Risk is significantly decreased in this instance, as there is no reliance on any specific sector or company. If the technology sector is suffering but healthcare companies are performing well, an investor in SPY will experience the decrease and increase of the various stock price changes within the S&P 500.
That being said, there is a "tipping point" for each asset class to achieve adequate diversification in order to lower risk. More securities within a fund generally mean lower risk, but hundreds of securities are not required in order to achieve proper diversification (research has shown that ~25 securities provide diversification benefits in a Large cap stock portfolio).
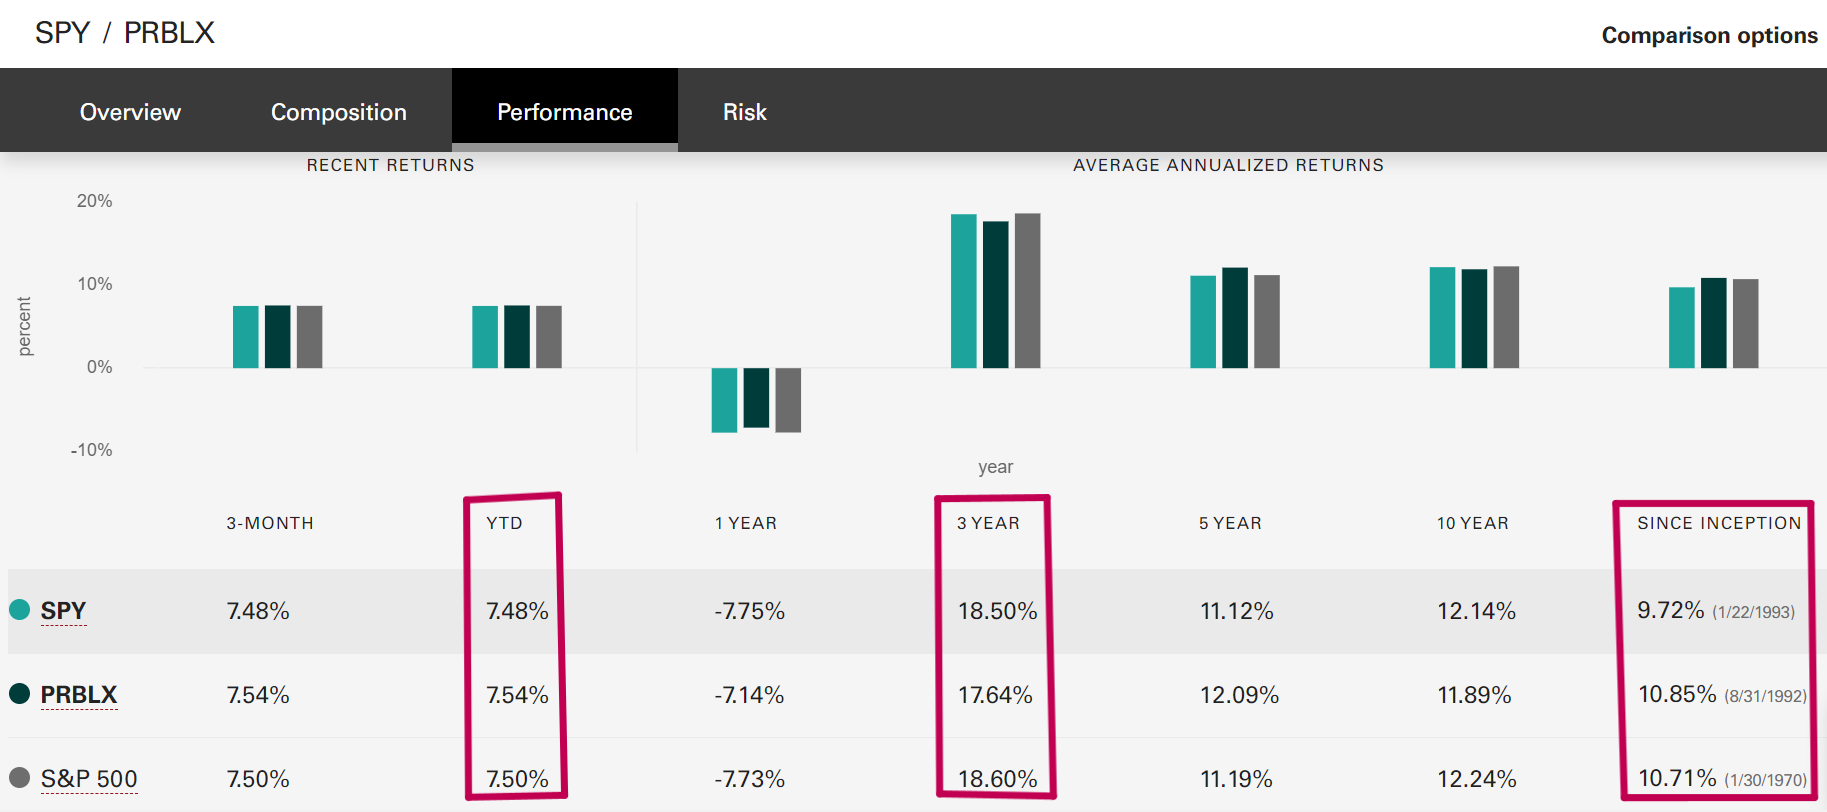
Lastly, let's hone in on one of the most pertinent pieces of information, the past performance record of each investment. The comparison tool will automatically generate a comparison between the S&P500 (listed at the bottom), which tells us that PRBLX outperformed SPY on some occasions.
I've singled out YTD (Year-To-Date), 3-year, and since inception performance data for no particular reason, other than to show that investors should consider multiple time periods when analyzing this data.
So PRBLX outperforms SPY for the majority of the time, right? Let's dig deeper, to see if this is really the case. For this next part, we will be using https://tools.finra.org/fund_analyzer/.
After entering each fund, we can insert the respective 10-year annualized returns of each investment, and see how $10,000 grows in each investment over a 10-year timeline (or "holding period"). Scroll to see how the fees have certainly dragged PRBLX's performance below that of SPY, there are further expenses that aren't taken into account such as trading costs, increased tax liabilities from PRBLX due to the active management, and more.
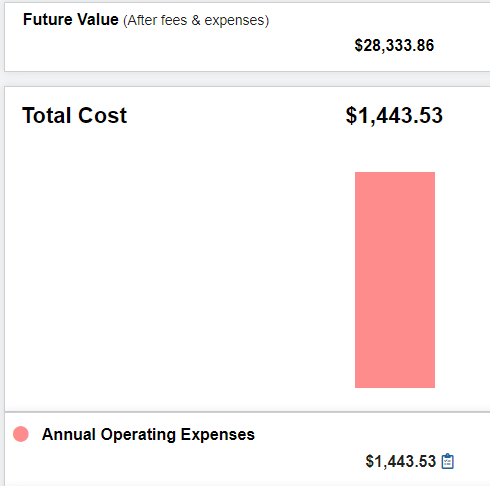
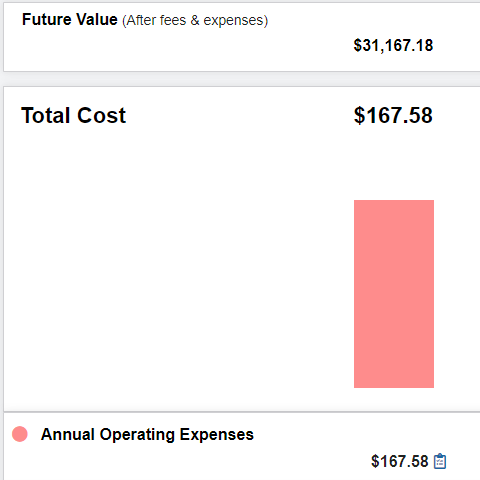
This may not appear to be a big deal, but the extra fees paid from investing in PRBLX will never get the chance to continue their compounding interest, and throughout the years the fund will suffer further and further in performance. If this does not highlight the importance of investing in low-cost investments over their costlier counterparts, I'm not sure what will.
Diversification:
We've discussed many of the most popular asset classes, which ones should we consider for investment? Would it be advantageous to invest all of our capital into Technology stocks since they are certainly the future, or maybe crypto, or gold?
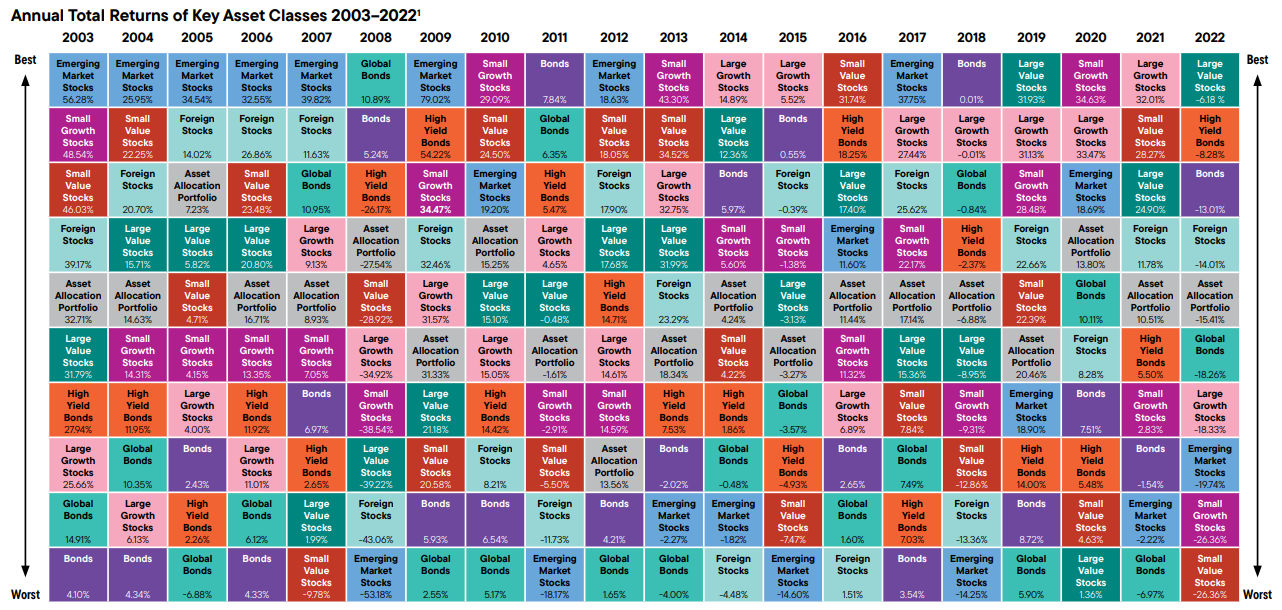
The correct answer is a classic lawyer response, it depends. It depends on the investor's goals, age, and tolerance for risk, among other considerations. Being that the purpose of this site is to relay information in a concise format, we will follow the basic idea of owning a mix of investments. We don't want to put all of our eggs in one basket and risk losing out on the performance of certain asset classes when they perform well relative to others. The chart below showcases the importance of diversification by tracking the performance of each investment since 2003.
Imagine how difficult it would be to look at past years and predict who will be the "winners" in the years to come..
The appropriate "mix" of investments will be discussed in a later post.
This website is a general communication being provided for informational purposes only. It is educational in nature and not designed to be a recommendation for any specific investment product, strategy, plan feature or other purposes.